We were standing up a new proof-of-concept environment for an internal AI workload an EC2 instance running a FastAPI backend, instrumented with CloudWatch for metrics and log delivery. Standard setup. The kind of thing an engineer should be able to provision, validate, and walk away from in under an hour.
Except it went quiet, creating an AWS observability blind spot
At 15:27 UTC, the CloudWatch Agent on the instance stopped publishing metrics and never recovered. The FastAPI application's log group existed in CloudWatch but contained zero data no streams, no bytes, nothing. From the outside, the instance looked healthy despite the AWS observability failure: EC2 hypervisor metrics were normal, SSM heartbeats continued. But our observability layer had silently collapsed.
The old way to debug this AWS observability failure would have been a 2-3 hour exercise.: SSH into the instance, tail log files, check systemd service statuses, audit SSM parameter history, cross-reference CloudWatch event timestamps manually. Instead, we let AWS DevOps Agent run the investigation.
The instance looked fine from the outside. The observability layer had silently collapsed from the inside. That gap is exactly what makes this class of failure expensive to debug manually.

The topology view above shows how the agent mapped our environment: three logical nodes which build infrastructure, code execution engine, and data storage all initially classified as Unknown, since the resources were provisioned via Terraform without the tag conventions the agent uses for auto-discovery. Despite this, the agent proceeded with investigation using direct AWS service API calls.
What the Agent found
AWS DevOps Agent began investigating the moment the CloudWatch alarm fired, restoring AWS observability into the failing environment. No human opened a dashboard. No one typed a query. The agent worked through the signal chain autonomously, and within 11 minutes it had produced a complete root cause analysis with two confirmed findings and two clearly documented data gaps.
Here is the investigation timeline as it played out:
AWS DevOps Agent did not guess around the IAM gaps. It documented them explicitly naming which APIs were unauthorized, what data those APIs would have provided, and what evidence would be needed to confirm the remaining hypotheses. This is the correct behaviour for a production investigation tool.
The two root causes
Root cause 1 - The 8-second configuration race condition
This AWS observability issue is subtle and easy to miss without the agent's timestamp correlation.
The CloudWatch Agent was configured at 14:47:58 using an SSM parameter that specified which log files to collect and which CloudWatch log groups to write to. That configuration was applied successfully; the agent began publishing metrics 10 seconds later at 14:48.
The problem: the SSM parameter was deleted at 14:48:06 just 8 seconds after it was used to configure the agent.
CloudWatch Agent periodically attempts to refresh its configuration from the SSM parameter path it was initialized with. When it attempted that refresh at approximately 15:27 UTC likely triggered by the package installation activity or a scheduled refresh cycle, the parameter no longer existed. The refresh failed, the agent crashed or entered a failed state, and metrics collection stopped permanently.
This explains everything: why metrics published cleanly from 14:48 to 15:27, why the stop was abrupt with no degradation curve, and why the FastAPI log group received zero data despite the log group itself existing. The AWS observability log collection configuration was lost when the agent failed
Root cause 2 - FastAPI was never running
The FastAPI application's CloudWatch log group within the AWS observability stack 'fastapi-app-log' was created at the same time as the instance launch but received zero data throughout the entire lifecycle of this investigation.
The agent identified two independent signals pointing to the application never starting:
- The security group only exposes port 80 (SSH + HTTP). FastAPI running via Uvicorn defaults to port 8000. If the application started and bound to 8000, it would be unreachable from outside and crucially, no traffic would reach it to generate logs.
- The process counts on the instance increased modestly from ~115 to ~125 processes at 15:20 consistent with installation processes spinning up, not with a running application server which would show a more significant and sustained jump.
Combined with the 225 MB download at 15:15–15:25, the pattern is clear: packages were being installed but the application either never started or failed immediately on startup, before producing any log output.
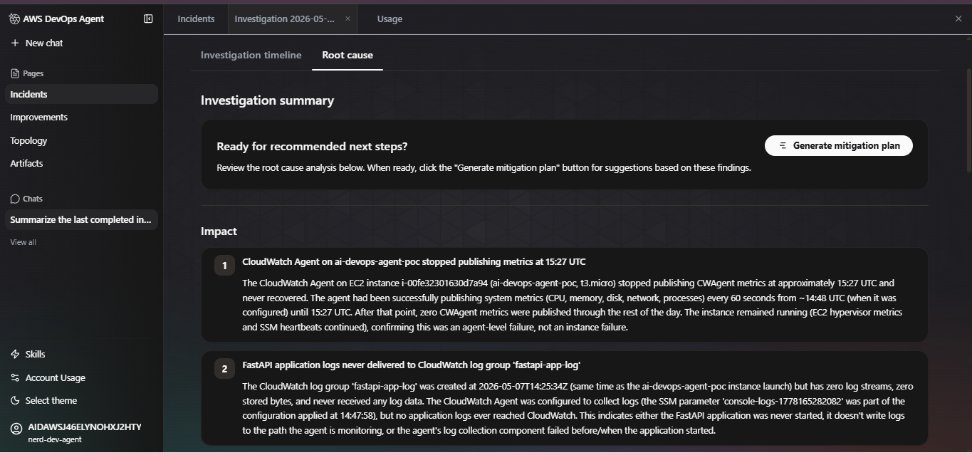
The screenshot above shows the investigation summary as the agent presented it - two numbered impact findings with full evidence chains, timestamped to the second, with a one-click 'Generate mitigation plan' prompt ready to run.
Where the Agent reached its limits and why that matters
The agent did not pretend it had complete AWS observability information. Two data gaps were explicitly logged, both caused by IAM permissions on the investigation role that did not cover OS-level access.
Gap 1 - No OS-level visibility in the AWS observability workflow
- EC2 GetConsoleOutput not authorized would have shown instance boot logs and kernel messages
- SSM GetCommandInvocation not authorized would have shown the CWAgent status check output from the command run at 14:48:39
- No system logs (syslog, dmesg, journald) shipped to CloudWatch only on the local filesystem
- CloudWatch Agent's own log files at /opt/aws/amazon-cloudwatch-agent/logs/ inaccessible without SSH or SSM access
These gaps mean we cannot confirm definitively whether the CWAgent crashed due to OOM, configuration error, or was manually stopped. The SSM parameter deletion timing is strong circumstantial evidence but the agent was correct to label it as a finding requiring additional evidence rather than a confirmed root cause.
Gap 2 - SSM history gone
The SSM parameter that held the CloudWatch Agent configuration was deleted within 20 seconds of being used. Its content specifically, which log file paths it was monitoring is permanently gone. Without that data, we cannot confirm whether the log collection configuration pointed to the correct FastAPI log output path in the first place.
The agent's documented AWS observability gaps are as valuable as its findings. They are an explicit checklist of what IAM permissions to add and what data to ship before the next investigation which is a better outcome than a human investigator silently skipping over the same blind spots.

Time saved, costs reduced, and the numbers proved it
This is not a hypothetical AWS observability MTTR comparison. Here is what the manual investigation of this incident would have required:
On-call engineer loaded rate: approximately $120–180/hour fully loaded. Manual investigation of this incident: 2–3.5 hours minimum. Cost of that investigation: $240–$630 in engineer time, for a single mid-severity incident.
That math compounds fast across a team running multiple services. The AWS observability agent does not replace the engineer who validates the hypothesis and executes the fix but it eliminates the context-assembly phase entirely, which is 70–80% of incident time for this class of failure.
Three things we're fixing based on this
1. IAM permissions for the investigation role
The agent documented exactly which APIs it could not call: EC2 GetConsoleOutput and SSM GetCommandInvocation. Both are read-only. Both are safe to add. We are extending the investigation role to include these permissions so the agent has OS-level visibility on the next run.
2. System logs to CloudWatch for stronger AWS observability
The CloudWatch Agent's own log files and the instance's system logs (syslog, journald) need to ship to CloudWatch, not just sit on the filesystem. This is a one-line addition to the CWAgent configuration. Without it, the agent and any human investigator is blind to instance-level failures.
3. SSM parameter lifecycle management
Parameters used to configure long-running agents should not be deleted after use. Either retain them, or use AWS Secrets Manager with versioning, or bake the configuration into the AMI or user data directly. The 8-second deletion window that caused this entire incident is an infrastructure hygiene issue, not a tooling limitation.
The incident itself was minor, but the AWS observability lessons were significant. The value was in what the investigation surfaced: three concrete infrastructure hygiene gaps that would have caused future incidents to be harder to debug than this one.

Our take on AWS DevOps Agent after this
We went into this evaluation skeptical. 'AI SRE' is a phrase that gets thrown around loosely and often means 'a dashboard with a chatbot attached.' AWS DevOps Agent is not that.
What it does for AWS observability, correlating metrics, log metadata, deployment events, and SSM history across a timestamp chain is exactly the kind of join operation that takes a human engineer 45 minutes and costs nothing for the agent to do in seconds. The SSM parameter deletion timing correlation is a good example: a human investigator would need to think to look at CloudTrail for parameter deletions, know the CWAgent refresh interval, and manually join those two signals. The agent did it as part of its standard investigation flow.
The IAM gaps it surfaced are better documentation than most postmortems we have written manually. The explicit 'evidence needed' notes in the gap records are a checklist for what to fix before the next incident something that rarely makes it into postmortem action items when humans write them under pressure.
What we are watching: autonomous remediation with proper guardrails, deeper compliance audit trail support, and how investigation quality holds on novel failure modes that don't match historical patterns.