After doing LLM testing of Gemini 3.8 Flash against Gemini 3.7 Flash, we found that the newer model gives enterprise teams a stronger case for migration. Google kept the pricing, context window, supported modalities, and model ID pattern unchanged, so benchmark performance becomes the main point of comparison.
We evaluated both models using GoML’s AI Matic Bench Score, which measures enterprise delivery readiness using published benchmark results and GoML’s LatticeBench evaluation.
Gemini 3.8 Flash scored 2.7 points higher overall. Our LLM testing shows where those gains came from and what LatticeBench found beyond the publicly reported benchmarks.
The one-line read
Gemini 3.8 Flash improves long-horizon performance, but it also costs more to run in practice even though the listed price stays the same. That trade-off explains why its weighted score rises by 2.7 points rather than showing a much larger jump.
What LLM testing of Gemini 3.8 Flash shows
Gemini 3.8 Flash keeps most of the same specifications as 3.7 Flash. It supports 1,048,576 input tokens and 65,536 output tokens. Its knowledge cut-off reaches March 2026, while some areas only include information up to January 2025. The model accepts text, images, and PDFs as input and returns text output.
Google positions Gemini 3.8 Flash as an update built on 3.7 Flash. The 3.7 model card still carries details on architecture, training data, and hardware. This points to a post-training and agent-loop update rather than a new base model.
Two changes matter in LLM testing of Gemini 3.8 Flash. Google removed the MINIMAL thinking level, so the model now supports LOW, MEDIUM, and HIGH thinking levels only.
The second change is pricing. The introductory rates stay in place until December 31, 2026. After that, input pricing moves from $0.75 to $1.50 and output pricing from $3.75 to $7.50. Context caching pricing also doubles.
LLM testing of Gemini 3.8 Flash published benchmark scores
Google published the evaluation results as an image inside a PDF, so many launch articles quote only a few benchmark numbers instead of the full table.
For this LLM testing of Gemini 3.8 Flash, we transcribed the complete table from Google’s evaluation document and checked it against two independent transcriptions. All three versions matched row by row.
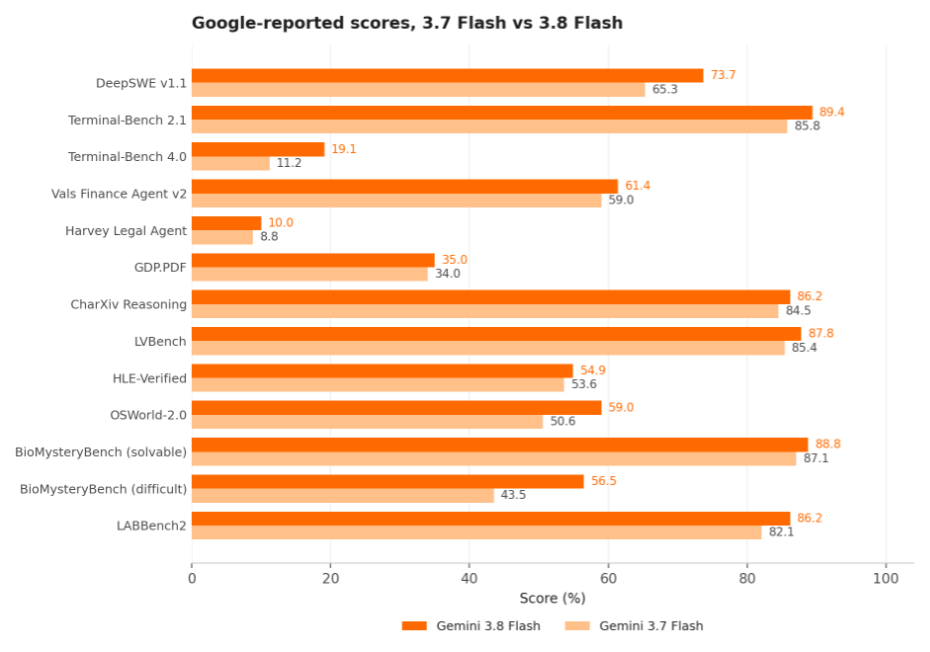
The sweep is real. It is also thin in most places. Nine of the fourteen rows move by under 4.2 points, which is inside the range a harness change or a grader revision can produce on its own. Four rows carry the release.
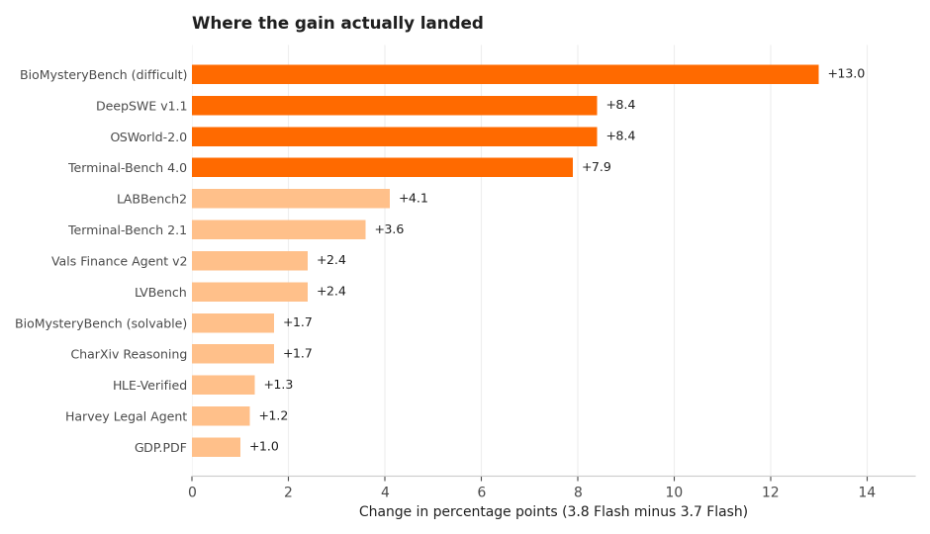
The strongest gains appear on longer tasks that require the model to keep working across many steps. Repository-scale engineering, computer use, and the difficult research split improve the most. Bounded single-pass reasoning changes much less.
For model selection, absolute scores matter more than relative gains. Terminal-Bench 4.0 rises from 11.2% to 19.1%, while Claude Opus 5 reaches 51.8% on the same chart. OSWorld-2.0 reaches 59.0% for Gemini 3.8 Flash and 75.4% for Opus 5. A large percentage gain from a low starting point does not always change the model choice for open-ended computer-use workloads.
Source conflicts we could not reconcile
We found four numeric conflicts across Google’s own pages and launch coverage. We keep both reported figures instead of averaging them, because an average would mix different runs or configurations.
Google explains more of its evaluation setup than many model vendors, but the cross-vendor numbers still need care. The OSWorld runs predate the benchmark team’s 08.08 patch, and the Opus 5 number came from a competitor blog rather than an in-house run. LVBench used 1,024 frames for Gemini and GPT models but only 300 for Claude because of API limits. Some expert-reasoning questions were also blocked by content filters for competitor models. These differences do not affect the Gemini 3.7 Flash versus 3.8 Flash comparison, but they make the Opus 5 and GPT columns useful as context rather than a direct ranking.
LLM testing of Gemini 3.8 Flash workload cost
Google designed Gemini 3.8 Flash to spend more effort on hard tasks. It takes more reasoning steps, makes more tool calls, and produces more output tokens at higher effort levels. Those extra tokens are billable because output pricing includes thinking tokens.
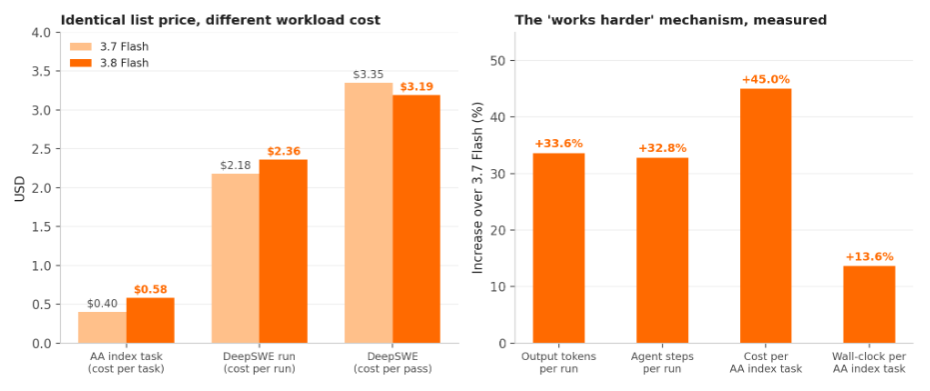
The public DeepSWE v1.1 leaderboard runs each model through the same mini-swe-agent harness. At high effort, Gemini 3.8 Flash scores 74% plus or minus 1, compared with 65% plus or minus 2 for 3.7 Flash. This supports Google’s reported +8.4-point gain. It also shows the extra work behind the score: 143,000 output tokens and 166 agent steps per run for 3.8 Flash, compared with 107,000 tokens and 125 steps for 3.7 Flash. Average run cost rises from $2.18 to $2.36, while the pass rate rises from about 65% to 74%. Cost per successful run therefore falls from about $3.35 to $3.19. On DeepSWE, the extra effort pays off.
Artificial Analysis shows a different cost pattern across a broader task mix. Gemini 3.8 Flash gains three Intelligence Index points, from 56 to 59 on v4.1.1, while cost per task rises about 45%, from $0.40 to $0.58. Wall-clock time moves from 2.2 to 2.5 minutes. Throughput improves from about 279 to 305 output tokens per second, but time to first token stays above 13 seconds. This profile fits batch and agent workloads better than latency-sensitive chat.
What the cost means for delivery
Cost per accepted result gives the clearest answer. Cost per token makes the two models look the same. Cost per benchmark task makes 3.8 Flash look 45% more expensive. Cost per successful DeepSWE run makes it about 5% cheaper. For an enterprise pipeline, the last measure is the one closest to the outcome being purchased.
GoML's own bench: LatticeBench
Public benchmarks show how the model performs on published test sets. LatticeBench adds GoML’s own enterprise codebase to the comparison. It contains identity, sales, SLA, engagement, organization, file store, work management, gateway, and AI copilot services, with 57 injected defects, including 18 critical-severity issues, plus 8 task prompts. We match each model claim against manifest.json by file path, line number, and description. Claims outside the manifest are checked against the untouched golden/ tree to confirm that the defect already existed. The test focuses on failure types that matter in enterprise software, including cross-tenant mass assignment, fail-open authorization, and shared-module blast radius.
LatticeBench attribution notes
Neither RESULTS file names the model under test. We map run 1 to Gemini 3.7 Flash and run 2 to Gemini 3.8 Flash from the run order. The table below keeps the labels as run 1 and run 2, so a corrected model mapping would change the labels rather than the scores. This mapping should be confirmed before external publication.
What improved in LatticeBench
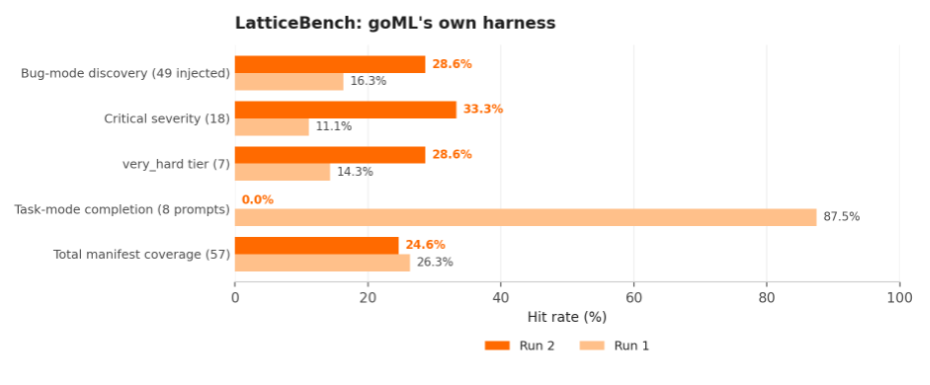
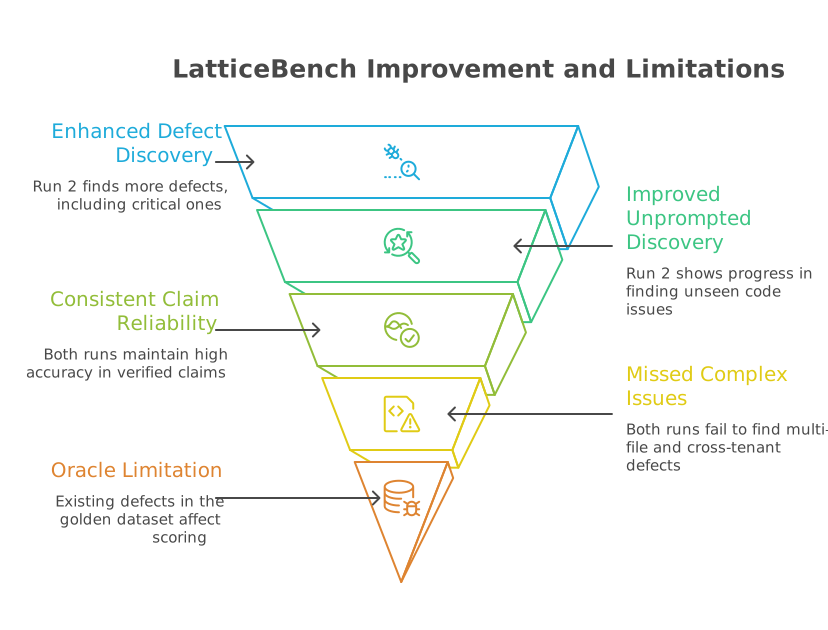
Run 2 finds every issue found by run 1 plus six more, so the extra findings form a strict superset rather than a different sample. Critical-severity discovery rises from 11% to 33%. Run 2 also catches the SQL injection in the handoff service, disabled JWT audience verification, the revoked-share bypass, and hardcoded AWS credentials that run 1 missed. Unprompted discovery rises by 12.6 points on the same fixed corpus, which supports the DeepSWE direction on code Google has not seen.
Claim reliability stays high in both runs. Across 57 claims, every reported issue was verified as a real defect. Run 1 produced zero fabrications across 22 claims, and run 2 produced zero across 35. For audit work, avoiding false positives matters because every incorrect finding creates review time.
What did not improve
Both runs still miss five of the seven very_hard issues. The remaining misses include multi-file mass-assignment chains, fail-open authorization checks, and shared common/ permission issues that spread across services. These cases require the model to trace logic across two or three files instead of finding a local defect in one place.
The main LatticeBench finding
LLM testing of Gemini 3.8 Flash shows a clear limit in multi-file reasoning. The model improves on long-horizon work, but both runs still miss every cross-tenant mass-assignment chain in the test set. These tasks require the model to hold a schema change in memory, follow it through a facade into a service, and then connect an unfiltered setattr loop to a tenant-boundary failure. This is a common failure pattern in multi-tenant SaaS systems, so human review should remain in this part of the workflow.
Two open questions limit the comparison. Run 2 does not address the 8 explicit task prompts, which is why total manifest coverage falls slightly even though bug discovery improves. The RESULTS2 note does not confirm whether those prompts were withheld or ignored, so the drop from 87.5% to 0% in task mode should not be treated as a model regression yet. Neither run also supplied a patched tree, so scoring uses prose claims plus source verification rather than a diff against golden/ for every manifest entry.
The oracle limitation
Together, the two runs found 27 real defects in golden/ that were not part of the injected set. They include a cross-tenant IDOR on team detail, sales analytics queries without organization filters, audit and activity endpoints missing tenant checks on one branch, timesheet approval protected only by IsAuthenticated, and an import that breaks epic enrichment. We verified each issue in the code and confirmed that it existed before the injected defects.
This creates a scoring issue for LatticeBench rather than a model issue. golden/ cannot act as a clean oracle while it still contains 27 untracked defects. Future runs could receive inconsistent credit for finding real bugs that have no manifest entry. Before the next run, GoML should patch those confirmed issues in golden/, bench/, and problem-set/ so the same baseline applies everywhere. Until then, treat the bug-mode hit rates as a lower bound.
LLM testing of Gemini 3.8 Flash using the AI Matic Bench Score
Vendor benchmark tables answer whether a new model scores higher. GoML needs a different answer: does changing the model improve accepted outcomes per rupee and per hour in a running enterprise pipeline without forcing a full requalification cycle? The AI Matic Bench Score v0.2 measures that question across nine axes. Each axis receives a 0 to 10 score from published evidence, independent testing, or GoML’s LatticeBench runs.
How much of the claim set is independently reproduced rather than vendor reported
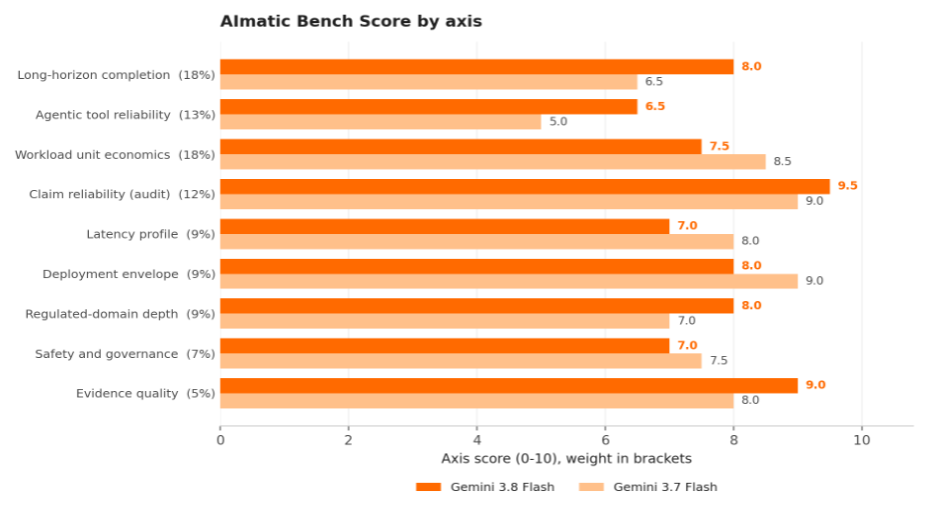
The weighting puts the most emphasis on long-horizon completion and workload unit economics, which together account for 36% of the score. Claim reliability carries 12% because a fabricated audit finding creates review work. Evidence quality carries 5% because it changes confidence in the other scores rather than measuring workload performance on its own.
LatticeBench supplies much of the evidence for three axes: all of claim reliability, part of long-horizon completion alongside DeepSWE, and part of agentic tool reliability alongside terminal and computer-use benchmarks. In total, 43% of the weighted score uses evidence generated by GoML as at least one input.
How the score is calculated
Each axis is scored 0 to 10 against the band anchors below. The total is the weighted sum of the axis scores, multiplied by ten to put it on a 100-point scale.
Formula
AImatic Bench Score = ( sum of ( axis score x axis weight ) ) x 10, where weights sum to 1.00 and each axis score is on a 0 to 10 band.
This axis alone rules the model out for the engagement class
For long-horizon completion, Gemini 3.8 Flash has three supported gains: DeepSWE improves by 8.4 percentage points and is independently reproduced at 74% versus 65%, BioMysteryBench difficult improves by 13.0 points, and LatticeBench unprompted discovery rises from 16% to 29%. The limit remains the hardest multi-file tier, where the two runs move only from 1 of 7 to 2 of 7 issues found. That places 3.8 Flash at 8.0 for this axis, compared with 6.5 for 3.7 Flash. Human review should still cover multi-file authorization paths.
The score bands still need tighter calibration. They describe the level of confidence but do not yet define a fully repeatable scoring procedure. Two engineers could read the same evidence and land about one point apart on an axis. Until GoML runs a blind inter-rater check, treat the total as accurate to about plus or minus one point.
Scoring and derivation
The total score matters less than the shape of the scorecard. Five axes improve and four fall. Long-horizon completion gains 1.5 points while workload unit economics loses 1.0, and both carry an 18% weight, so much of the difference cancels out. Smaller gains in claim reliability, regulated-domain depth, and evidence quality move the result to 77.9 from 75.2. The net change is +2.7 points.
What the AI Matic Bench Score does not cover
- LatticeBench scores prose claims rather than patched code. No diff-based rescore against golden/ has been run for each manifest entry, and golden/ still contains 27 confirmed defects outside the injected set.
- The LatticeBench run-to-model mapping comes from run order rather than an explicit model label in the results files. Run 2 also has an unresolved task-mode configuration question.
- We did not run multilingual or Indic-language tests. Google’s own multilingual score falls by 5.4 points, so teams using non-English workloads should test them separately.
- We did not run retrieval-grounded tests. None of the published benchmark rows isolates RAG performance.
- The score bands are descriptive and have not yet gone through a blind inter-rater check. Treat each axis score as about plus or minus one point.
- The weights reflect GoML’s delivery priorities. A latency-sensitive consumer product could place more weight on latency, which would favour Gemini 3.7 Flash.
The GoML position
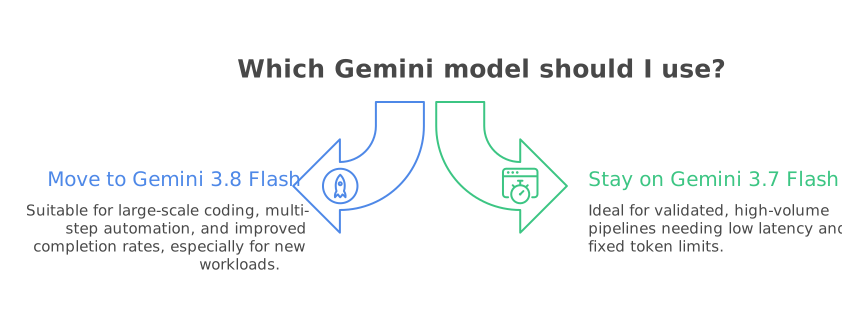
Move to Gemini 3.8 Flash when
- Your workload uses repository-scale coding, multi-step terminal automation, or agent loops that often stop before finishing the task.
- You measure success by accepted results and can absorb about a third more tokens and turns when the completion rate improves.
- Your pipeline runs in batch or asynchronously, so a time to first token above 13 seconds has little effect on the end user.
- You are starting a new Gemini workload. The model ID remains stable and the current list price matches 3.7 Flash.
- You keep human review for multi-file authorization paths. Neither run catches the cross-tenant mass-assignment cases in LatticeBench.
Stay on Gemini 3.7 Flash when
- Your pipeline is already validated, runs at high volume, and depends on low latency. Classification, extraction, and routing show little reason to pay for the extra effort.
- Output-token or tool-call limits are fixed.
- You depend on the MINIMAL thinking level, which Gemini 3.8 Flash no longer accepts.
- Non-English performance matters to the contract and you have not retested against the reported 5.4-point multilingual drop.
Migration steps after LLM testing of Gemini 3.8 Flash
Do not change the model and the traffic split in the same release. Shadow Gemini 3.8 Flash against production 3.7 Flash traffic by task class. Log reasoning tokens, visible output tokens, tool calls, retries, accepted-result rate, and p95 latency. Promote only the task classes where the higher accepted-result rate covers the extra token use. Start at LOW or MEDIUM thinking and reserve HIGH for tasks that show a clear need for it. Use the January 2027 pricing in annual cost models rather than the introductory rate.
The larger lesson from this LLM testing of Gemini 3.8 Flash is that model choice needs regular retesting. Google shipped three Flash releases in 43 days, with each one improving most published scores. Teams should keep the model behind an interface, keep one evaluation harness, and rerun the comparison as the Flash tier changes.
How GoML verified LLM testing of Gemini 3.8 Flash
Every number in this comparison traces to a named source. We checked the 14-row Google table against two independent transcriptions of the evaluation PDF, and all three copies matched row by row. Independent figures come from the public DeepSWE v1.1 leaderboard and Artificial Analysis Intelligence Index v4.1.1, both of which identify their harness and version. When sources disagree, we show both figures instead of averaging them.
LatticeBench numbers come from the two scored run reports. Each unmatched claim is checked against the current golden/ file at the cited location to confirm that the defect is real and appears in both golden/ and bench/. Where a run report corrected an earlier count, we use the corrected number. The critical-severity total is 18, not 16. Neither run supplied patched code, so both are scored from prose claims plus source checks.
The AI Matic platform axis scores are GoML’s editorial scoring of the evidence, not direct measurements. The derivation column shows why each score moved. Teams that apply different weights to the nine axes will get a different total, which is expected.
Frequently asked questions
1. Did task-mode completion really fall from 88% to 0%?
Not necessarily. Run 2 did not address the eight task prompts, so the 0% score does not prove a real regression.
2. Do better bug-finding scores mean it is ready for security-critical review?
Only partly. Bug discovery improved and critical findings tripled, but both runs still missed five of the seven hardest multi-file issues. Human review is still needed.
3. Why do benchmark scores differ across sources?
Different test setups are often reported together. GoML uses Google’s main evaluation PDF as the main reference and treats conflicting figures as directional.